EV Charging Cost Calculator
Short answer
At the national average residential rate of about 16.5 cents per kWh, filling a 75 kWh battery from empty costs roughly $13 including charging losses, and a normal 20 to 80 percent charge costs about $8. On an off-peak EV rate the same charge often costs half as much.
Charging cost is the simplest calculation on the site and the one people most often get slightly wrong, because they forget that you pay for the energy that enters the charger, not the energy that reaches the battery. Roughly ten percent is lost in the vehicle onboard charger, in cable resistance and in thermal management.
Once you account for that, the arithmetic is one line: energy needed, divided by efficiency, multiplied by your rate. At the national average of about 16.5 cents per kWh, a 45 kWh charge costs about eight dollars and 25 cents.
If you want the real number, not the estimate
Measure what you actually spend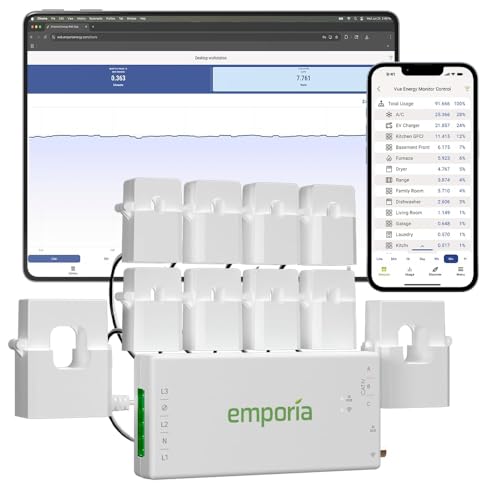
EMPORIA
Emporia Vue 3 Energy Monitor, 8 Sensors
$149.99
The only way to know what charging actually costs you is to meter the charger circuit separately from the rest of the house. This clamps onto the mains and the charger circuit and reports both, which also gives you the evidence a utility EV rate programme usually wants.
- Sensors
- 8
- Mains
- Yes
- Per circuit
- Yes
- App
- iOS and Android
- Data
- Real time
- Install
- Electrician
Paid link. Price shown when researched.
Charging cost
kWh x rateIncludes charging losses, which are the part most estimates omit. Enter the rate from your bill, not a headline figure, and remember that delivery charges are often larger than the energy charge itself.
All-in cents per kWh from your bill, energy plus delivery. Not the headline supply rate.
Cost of this charge
$8.25
45.0 kWh into the pack, 50.0 kWh billed
- Cost per mile
- 5.2 cents
- Range added
- 158 miles
- Full charge from empty
- $13.75
- Cost per 1,000 miles
- $52
- Lost to charging inefficiency
- $0.92
Use the all-in rate from your bill, not the headline number
This is the most common source of error and it is usually large. Utility bills separate a supply or energy charge from delivery, distribution, transmission and various riders. People quote the supply rate because it is the biggest number on the page, and in many regions the delivery component is comparable to or larger than the energy component itself.
The reliable method: take the total dollar amount of the bill, subtract genuinely fixed monthly charges, and divide by the kWh used. That gives you the marginal cost of the next kWh, which is what charging actually costs you. In some regions this is nearly double the advertised supply rate.
One caveat in the other direction. If your utility has tiered rates that rise with consumption, charging may push you into a higher tier, so the marginal rate for charging can exceed your average rate. If your utility offers an EV or time-of-use tariff, the marginal off-peak rate can be far lower. Both cases are covered on the time-of-use rates page.
Charging losses, and where they go
You are billed at the meter and the car reports what reached the battery, and the two numbers never match. The gap has three components.
- Onboard charger conversion. AC to DC conversion is roughly 92 to 95 percent efficient, and the losses appear as heat in the vehicle.
- Conductor resistance. Small on a short run, larger on a long one. This is one more reason to keep voltage drop inside the target.
- Thermal management. Pumps, fans and heaters run during charging, and in cold weather the pack may be warmed from wall power. This is the variable component and it is why winter charging costs more per mile.
Ninety percent is a fair year-round planning figure for Level 2. Level 1 is meaningfully worse, commonly 80 to 85 percent, because the fixed overhead of running the vehicle systems is a much larger fraction of a 1.4 kW input. That is a real if secondary argument for Level 2, and it is picked up in Level 1 versus Level 2.
What it costs where you live
Residential electricity prices vary by more than three times across the country, so the same car costs very different amounts to run depending on the state.
| Cheapest states | Cents per kWh | Full 75 kWh charge | Cost per mile at 3.5 mi per kWh |
|---|---|---|---|
| North Dakota | 11.1 | $9.25 | 3.5 cents |
| Idaho | 11.4 | $9.50 | 3.6 cents |
| Utah | 11.5 | $9.58 | 3.7 cents |
| Nebraska | 11.6 | $9.67 | 3.7 cents |
| Wyoming | 11.6 | $9.67 | 3.7 cents |
| Most expensive states | Cents per kWh | Full 75 kWh charge | Cost per mile at 3.5 mi per kWh |
|---|---|---|---|
| Hawaii | 41 | $34.17 | 13.0 cents |
| California | 31.8 | $26.50 | 10.1 cents |
| Connecticut | 30.6 | $25.50 | 9.7 cents |
| Massachusetts | 29.8 | $24.83 | 9.5 cents |
| Rhode Island | 27.5 | $22.92 | 8.7 cents |
The full table for every state is on the electricity rates by state chart. Two things worth noting. In the most expensive states, home charging can approach the cost per mile of an efficient petrol car, which is worked through in EV versus gas fuel cost. And it is precisely in those states that an EV time-of-use tariff matters most, because the off-peak rate is often a fraction of the standard one.
Cost per charge by vehicle
| Vehicle | Usable pack | Full charge at national average | 20 to 80 percent | Cost per mile |
|---|---|---|---|---|
| Tesla Model Y | 75 kWh | $13.75 | $8.25 | 4.7 cents |
| Tesla Model 3 | 75 kWh | $13.75 | $8.25 | 4.4 cents |
| Tesla Cybertruck | 123 kWh | $22.55 | $13.53 | 7.6 cents |
| Ford F-150 Lightning | 131 kWh | $24.02 | $14.41 | 9.2 cents |
| Ford Mustang Mach-E | 91 kWh | $16.68 | $10.01 | 5.6 cents |
| Chevrolet Equinox EV | 85 kWh | $15.58 | $9.35 | 5.4 cents |
| Chevrolet Bolt EUV | 65 kWh | $11.92 | $7.15 | 5.1 cents |
| Hyundai Ioniq 5 | 84 kWh | $15.40 | $9.24 | 5.2 cents |
| Kia EV6 | 84 kWh | $15.40 | $9.24 | 5.2 cents |
| Rivian R1T | 135 kWh | $24.75 | $14.85 | 8.3 cents |
| Nissan Leaf | 60 kWh | $11.00 | $6.60 | 5.2 cents |
| Volkswagen ID.4 | 77 kWh | $14.12 | $8.47 | 5.7 cents |
| Honda Prologue | 85 kWh | $15.58 | $9.35 | 5.7 cents |
| Toyota bZ4X | 64 kWh | $11.73 | $7.04 | 5.2 cents |
Notice that pack size sets the cost of a charge and efficiency sets the cost of a mile, and they pull in different directions. A large inefficient truck has both an expensive charge and an expensive mile. An efficient sedan with a large pack has an expensive charge and a cheap mile, because that charge takes it much further.
How to actually reduce the number
- Move to an EV or time-of-use tariff, if one exists. This is by far the largest lever and it costs nothing but a phone call. Off-peak rates are frequently half the standard residential rate. Model it on the time-of-use savings calculator.
- Schedule charging into the cheap window. Every electric car can do this from the dashboard, so you do not need a smart charger for it, although smart chargers make it easier to see what happened.
- Precondition while plugged in. Warming or cooling the cabin on wall power rather than on the battery is both cheaper and better for range.
- Charge to 80 percent daily. Better for the pack on most chemistries, and the last 20 percent is the least efficient part of the session.
- Consider solar, with realistic expectations. The maths is genuinely favourable in some places and marginal in others. Run it honestly on the solar charging calculator.
Where to go next
Compare against fuel on the cost per mile calculator, work out whether the install pays for itself on the payback calculator, and see the full rate table on the electricity rates by state chart. If you have not installed yet, price the job on the installation cost calculator.
Common questions
How much does it cost to charge an EV at home?
At the national average residential rate of about 16.5 cents per kWh, filling a 75 kWh battery from empty costs roughly 12 to 14 dollars once charging losses are included. Charging from 20 to 80 percent, which is the normal daily pattern, costs about 8 dollars. On an off-peak EV rate the same charge often costs half that.
Why does the meter show more energy than the car received?
Because charging is not lossless. Energy is lost in the vehicle onboard charger converting AC to DC, in cable resistance, and in battery thermal management. Around 90 percent efficiency is a reasonable planning figure for Level 2, meaning you pay for about 11 percent more energy than the pack receives. Level 1 is worse, often 80 to 85 percent.
Is a special EV electricity rate worth switching to?
Usually yes if your utility offers one and you can shift charging to the off-peak window, which is trivial since the car is parked overnight anyway. Off-peak EV rates are frequently half the standard residential rate or better. The catch is that on-peak rates are usually higher, so the saving depends on the rest of your household usage as well as on charging.
Does charging at home raise my electricity bill noticeably?
Yes, and you should expect it. A driver covering 1,000 miles a month at 3.5 miles per kWh uses about 285 kWh, which at the national average adds roughly 47 dollars to the bill. That is normally far less than the fuel it replaces, but it appears as an increase on one bill rather than as a saving on another, which surprises people.
Do smart chargers save money?
Only through scheduling, and only if you are on a time-varying rate. A smart charger that shifts charging into an off-peak window on a time-of-use tariff can save meaningful money. On a flat rate it saves nothing, because a kWh costs the same at any hour. The car itself can usually schedule charging without any help from the charger.
Should I include the installation cost in the cost per charge?
Not in the cost per charge, but do account for it in the payback calculation. The install is a one-off capital cost and the charging cost is ongoing, so mixing them makes the first year look expensive and every later year look free. Keep them separate, then compare the total against the alternative over several years.
Getting your own panel and load numbers ready for an electrician? The EV Home Charging Install Planner is the paid version of these pages: 8 printable worksheets you fill in with your own numbers, plus the full PDF, $29.
How this page was researched
Specifications come from manufacturer documentation, listed safety certifications and verified owner reviews. We do not perform hands-on product testing and never claim to. Figures are researched planning information, not professional electrical advice. Last reviewed 2026-08-17.