Cost Per Mile Chart
Short answer
Cost per mile is your electricity rate in cents per kWh divided by your car's miles per kWh, divided again by 0.9 for charging losses. At the US average rate of 16.5 cents and 3.5 miles per kWh, that is 5.2 cents per mile. Home charging generally runs 3 to 12 cents per mile, while public fast charging at 48 cents per kWh is around 13.7 cents.
This is the grid that answers what your driving actually costs. Find your electricity rate down the left, find your car's efficiency along the top, and read off cents per mile. Every figure includes ten percent for charging losses, because the energy your meter records is always more than the energy that reaches the battery, and a comparison that leaves that out is quietly ten percent optimistic.
What makes the cheap column real
What makes the cheap column real
EMPORIA
Emporia Level 2 EV Charger, 48A J1772
$449.00
Every cheap number on this page assumes you charge at home. This is the unit that makes that the default: 48 amps hardwired, a 25 foot cable so plugging in is never a chore, and per-session energy reporting so you can check the cents-per-mile arithmetic against your own bill rather than trusting a table.
- Output
- 11.5 kW
- Circuit
- 60 A
- Cable
- 25 ft
- Reporting
- Per session
- Install
- Hardwired
- Connector
- J1772
Paid link. Price shown when researched.
Cents per mile, by rate and efficiency
| Rate | 2 mi/kWh | 2.4 mi/kWh | 2.8 mi/kWh | 3.2 mi/kWh | 3.5 mi/kWh | 3.9 mi/kWh | 4.2 mi/kWh |
|---|---|---|---|---|---|---|---|
| 10c per kWh | 5.6 | 4.6 | 4.0 | 3.5 | 3.2 | 2.8 | 2.6 |
| 12c per kWh | 6.7 | 5.6 | 4.8 | 4.2 | 3.8 | 3.4 | 3.2 |
| 14c per kWh | 7.8 | 6.5 | 5.6 | 4.9 | 4.4 | 4.0 | 3.7 |
| 16c per kWh | 8.9 | 7.4 | 6.3 | 5.6 | 5.1 | 4.6 | 4.2 |
| 18c per kWh | 10.0 | 8.3 | 7.1 | 6.3 | 5.7 | 5.1 | 4.8 |
| 20c per kWh | 11.1 | 9.3 | 7.9 | 6.9 | 6.3 | 5.7 | 5.3 |
| 24c per kWh | 13.3 | 11.1 | 9.5 | 8.3 | 7.6 | 6.8 | 6.3 |
| 28c per kWh | 15.6 | 13.0 | 11.1 | 9.7 | 8.9 | 8.0 | 7.4 |
| 32c per kWh | 17.8 | 14.8 | 12.7 | 11.1 | 10.2 | 9.1 | 8.5 |
| 36c per kWh | 20.0 | 16.7 | 14.3 | 12.5 | 11.4 | 10.3 | 9.5 |
| 41c per kWh | 22.8 | 19.0 | 16.3 | 14.2 | 13.0 | 11.7 | 10.8 |
The top left corner of that grid is an efficient sedan on cheap electricity, at under three cents a mile. The bottom right is a large electric truck on Hawaii or California pricing, well into double figures. Both are electric cars charged at home, and they differ by a factor of six. This is why the phrase "electric cars are cheap to run" is close to meaningless without your own two numbers attached to it.
Where does 2.0 miles per kWh come from? Large electric trucks with big frontal areas and heavy kerb weights. Where does 4.2 come from? Efficient sedans in mild weather. Neither figure survives a winter unchanged, which is the largest caveat on this page and the one no chart can carry for you.
The petrol comparison, on the same scale
Petrol prices out in exactly the same units, so you can lay it against the grid above rather than converting anything. These figures use $3.40 a gallon; scale them linearly for another price.
| Fuel economy | Fuel price | Cents per mile | 12,000 miles |
|---|---|---|---|
| 20 mpg | $3.40 | 17.0 | $2040 |
| 25 mpg | $3.40 | 13.6 | $1632 |
| 30 mpg | $3.40 | 11.3 | $1360 |
| 35 mpg | $3.40 | 9.7 | $1166 |
| 45 mpg | $3.40 | 7.6 | $907 |
Put the two tables side by side and the pattern is clear. Almost every cell in the electricity grid is cheaper than almost every cell in the petrol one, and the exceptions are all in the same corner: inefficient electric vehicles on expensive electricity, compared against efficient hybrids on cheap fuel. The full argument with annual totals is in EV vs gas fuel cost.
Every vehicle on this site, at three rates
| Vehicle | Efficiency | At 10c | At 16.5c | At 32c | 12,000 mi at average |
|---|---|---|---|---|---|
| Tesla Model 3 | 4.2 mi/kWh | 2.6 | 4.4 | 8.5 | $524 |
| Tesla Model Y | 3.9 mi/kWh | 2.8 | 4.7 | 9.1 | $564 |
| Chevrolet Bolt EUV | 3.6 mi/kWh | 3.1 | 5.1 | 9.9 | $611 |
| Hyundai Ioniq 5 | 3.5 mi/kWh | 3.2 | 5.2 | 10.2 | $629 |
| Kia EV6 | 3.5 mi/kWh | 3.2 | 5.2 | 10.2 | $629 |
| Nissan Leaf | 3.5 mi/kWh | 3.2 | 5.2 | 10.2 | $629 |
| Toyota bZ4X | 3.5 mi/kWh | 3.2 | 5.2 | 10.2 | $629 |
| Chevrolet Equinox EV | 3.4 mi/kWh | 3.3 | 5.4 | 10.5 | $647 |
| Ford Mustang Mach-E | 3.3 mi/kWh | 3.4 | 5.6 | 10.8 | $667 |
| Volkswagen ID.4 | 3.2 mi/kWh | 3.5 | 5.7 | 11.1 | $688 |
| Honda Prologue | 3.2 mi/kWh | 3.5 | 5.7 | 11.1 | $688 |
| Tesla Cybertruck | 2.4 mi/kWh | 4.6 | 7.6 | 14.8 | $917 |
| Rivian R1T | 2.2 mi/kWh | 5.1 | 8.3 | 16.2 | $1000 |
| Ford F-150 Lightning | 2 mi/kWh | 5.6 | 9.2 | 17.8 | $1100 |
Sorted cheapest first, and the ordering is entirely efficiency: pack size, price and charging speed have no effect on cost per mile at all. A large pack costs more to fill and goes further on that fill, so the two cancel. This is worth internalising, because "expensive to charge" and "expensive per mile" are different claims, and only the second one affects what you spend in a year.
What moves your number, in order
Your electricity rate, by a wide margin
The rate spread across the country is more than three to one, which is larger than the spread in vehicle efficiency. The important refinement is to use your marginal rate rather than a state average, because delivery charges, fixed fees and tiered pricing sit between the headline number and your bill. Divide a recent bill's total by the kilowatt hours on it for a better figure than any table can give you. The state-level comparison is on the electricity rates by state chart.
Time of use, which is the lever you control
An EV time-of-use plan can price overnight energy well below the standard residential rate, and overnight is when a home charger runs anyway. Shifting every charge into an off-peak window commonly moves cost per mile by a third with no change to the car or the hardware, which is a bigger improvement than any realistic change of vehicle. Quantify it in the time-of-use savings calculator.
Where you charge
Home against public is a three to four times difference, and it is the reason the charger install pays for itself. Anyone relying on public fast charging for daily driving is paying something close to petrol prices for fuel. The two routes are compared properly in home vs public fast charging.
Weather and driving style
Cold weather is worth 20 to 40 percent in consumption on a bad day, and sustained high speed is worth a similar amount because aerodynamic drag rises with the square of speed. Neither is in this chart. If you drive fast in a cold climate, treat your real cost per mile as meaningfully above the value in the grid.
Turn this estimate into a measurement
Every number here is a model of your driving until something in the panel measures the actual circuit.
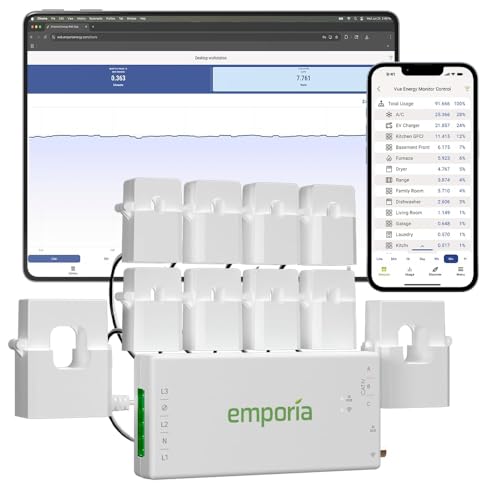
EMPORIA
Emporia Vue 3 Energy Monitor, 8 Sensors
$149.99
Measures the charger circuit and the mains directly, so cost per mile comes from a current sensor rather than from an estimate. It is also the only practical way to confirm a time-of-use plan is actually saving what it promised.
- Sensors
- 8
- Measures
- Mains and circuits
- Data
- Real time
- Install
- At the panel
Trade-off Panel-mounted, so it is part of an electrician visit rather than a plug-in purchase.
Check price
Refoss
Refoss Smart Home Energy Monitor, 16 Circuits
$169.99
Sixteen circuit sensors with local control, for a household that wants the data without depending on a manufacturer cloud service to see it.
- Sensors
- 16
- Control
- Local
- Circuits
- Up to 16
- Install
- At the panel
Trade-off More sensors than most people install, and it still needs a spare panel space to mount in.
Check price
EMPORIA
Emporia Pro 48A with PowerSmart Load Management
$599.00
Combines whole-home measurement with a charger that throttles itself, which is what turns measurement into a saving rather than a chart. On a tight panel this device can replace a service upgrade.
- Output
- 48 A
- Measures
- Whole home
- Load management
- Dynamic
- Circuit
- 60 A
Trade-off The load management function needs its sensors installed in the panel to do anything.
Check pricePaid links. Prices shown when researched and change without notice.
Turning cents per mile into a decision
The number this chart is really for is the annual one. Take your cents per mile, multiply by your real annual mileage, and divide by 100 for dollars a year. Do the same for the car you would otherwise drive. The difference is what a home charging installation earns you every year, and it is the numerator of the payback calculation.
Against the plug-in Level 2 buildout at $1,605 including labour and permit, or the hardwired 48 amp buildout at $2,466, a typical household saving lands the payback in the low single digit years, sooner if the alternative is public fast charging and later in an expensive electricity state. Run yours in the payback calculator rather than accepting an average, because the inputs vary by more than the result does.
How this chart was researched
Electricity rate figures use average residential prices, with the national average of 16.5 cents per kWh applied consistently across this site. Vehicle efficiency figures come from published manufacturer specifications and EPA ratings and vary with weather, speed, terrain, payload and driving style. Charging losses are taken at ten percent throughout. Public fast charging is priced at a commonly observed rate rather than any particular network's tariff. Petrol figures state their assumptions in the table so you can substitute your own.
We do not perform hands-on vehicle or product testing and never claim to. Everything here is researched planning information rather than professional financial advice, and prices change without notice.
Where to go next
Put your own figures into the cost per mile calculator or the charging cost calculator. For the hardware that gets you onto the cheap column, see best Level 2 home chargers, and for what the install costs, the installation cost chart.
Common questions
How do I calculate cost per mile for an electric car?
Divide your electricity rate in cents per kWh by your car's efficiency in miles per kWh, then divide again by 0.9 to account for charging losses. At the US average of 16.5 cents and 3.5 miles per kWh, that is 5.2 cents per mile. The same arithmetic for petrol is the price per gallon divided by miles per gallon, multiplied by 100.
Why do these figures include charging losses?
Because your meter records more energy than reaches the battery. Some is lost to conversion in the vehicle onboard charger, some to battery thermal management, and some to keeping the car awake during the session. Ten percent is a reasonable planning figure and it is applied consistently across this site. Comparisons that omit it come out about ten percent too cheap, which is small but systematic.
What is a typical cost per mile for an EV?
Between about 3 and 12 cents per mile at home, depending far more on your electricity rate and your vehicle's efficiency than on anything else. A mid-size crossover at the national average rate is about 5.2 cents. An efficient sedan on cheap electricity can be under 3 cents. A large electric truck on expensive electricity can exceed 15 cents, which is petrol territory.
How does public fast charging compare?
Around 13.7 cents per mile for a mid-size crossover at a typical DC fast charging price of 48 cents per kWh, which is roughly three times the home figure and close to what a reasonably efficient petrol car costs. No home charging loss is applied to that figure because the energy is metered at the post rather than at your house. This is the arithmetic that makes a home charger installation worth paying for.
Does cold weather change cost per mile?
Substantially, and it is the largest short-term variable on this page. Cabin heating, battery conditioning and reduced regeneration can raise consumption by 20 to 40 percent in genuinely cold conditions, and charging losses rise too. Nothing on this chart accounts for that, so treat winter cost per mile as noticeably higher than the annual average implied here.
Should I use my state average rate or my actual rate?
Your actual marginal rate, meaning what the next kilowatt hour costs you including delivery charges and any tier you are in. State averages are useful for comparison and poor for budgeting, because delivery charges, fixed fees and tiered pricing all sit between the headline rate and what you actually pay. Divide a recent bill total by the kWh on it for a better figure.
Getting your own panel and load numbers ready for an electrician? The EV Home Charging Install Planner is the paid version of these pages: 8 printable worksheets you fill in with your own numbers, plus the full PDF, $29.
How this page was researched
Specifications come from manufacturer documentation, listed safety certifications and verified owner reviews. We do not perform hands-on product testing and never claim to. Figures are researched planning information, not professional electrical advice. Last reviewed 2026-08-17.